01 / Business goal
What this concept is trying to solve
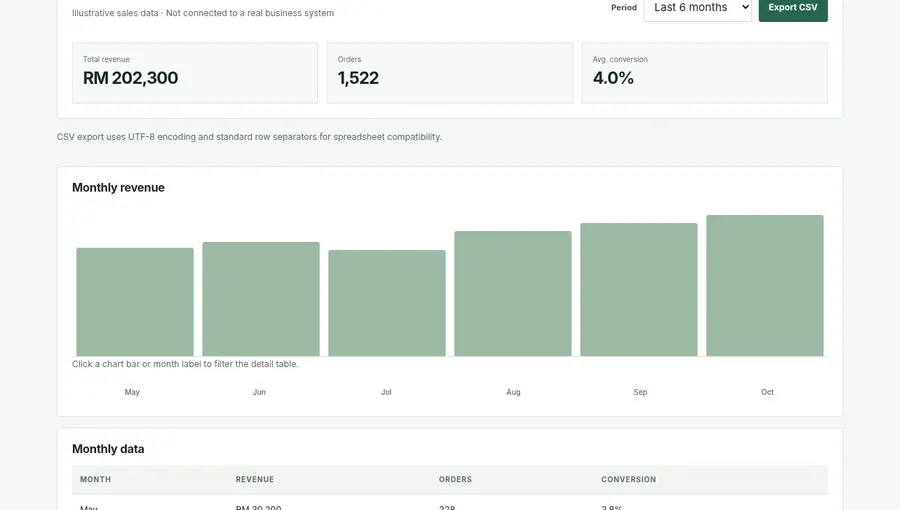
Let a manager scan key indicators quickly, then explore a smaller slice of sample data.
02 / Product decisions
Why the flow is structured this way
- Separate high-level KPIs from detail views.
- Pair charts with readable labels rather than relying on colour alone.
- Offer a CSV export for downstream spreadsheet workflows.
03 / Interactive scope
What the demonstrator includes
- Sample KPI cards and charts
- Period filters
- Order and metric summaries
- CSV export of sample data